Back to Insights
LMA Summary of Lloyd's Results 2024: Part 1
Lloyd’s announced its best ever profit last week of more than £11bn which sets it on course to achieve its best returns on capital for over 15 years. As part of the LMA’s desire to share analyses and insights with our members, this summary of Lloyd’s press announcement will be followed by a more comprehensive report which we will make available to our members soon after the publication of all the syndicates’ accounts on 28 March 2024. These reports and analyses are a collaboration between the LMA and Insurance Capital Markets Research (ICMR), the independent Lloyd’s quantitative analysts.
While underwriting performance improved to an 84.0% combined ratio (91.9% in 2022), the biggest change was in syndicates’ investment returns. This showed a positive return of £5.3bn following the £3.1bn loss of last year, which itself was more of a mark-to-market loss due to the change in interest rate environment. This has now returned to positive territory and is of similar quantum to underwriting returns, as follows:
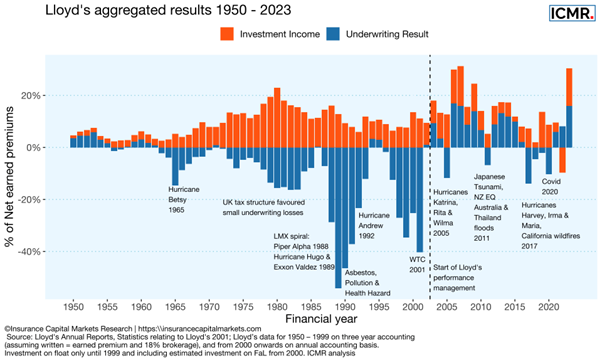
The above chart shows the historical key drivers of Lloyd’s returns, being underwriting and syndicate investments, and the contribution of both to Lloyd’s aggregate result over time. The importance of syndicate investment returns to Lloyd’s overall result is set to continue with higher risk free rates than generally seen over the last decade. The graph also shows the clear change in performance in the early 2000s with the implementation of Lloyd’s performance management regime following the WTC losses of 2001.
This result also marks the first time in the last decade that Lloyd’s has, in the aggregate, exceeded its estimated weighted average cost of capital (WACC). Establishing Lloyd’s WACC is by no means an easy task as the cost of equity and debt have to be estimated. However, the RISX equity index of publicly traded parent companies at Lloyd’s allows for a calculation of the ‘as-if’ market capitalisation of Lloyd’s and its beta (a measure of a stock’s volatility in relation to the overall market), both of which are key inputs in the calculation of the WACC figure.
The following chart shows Lloyd’s pro-forma returns to investors from 2007 - 2022 along with ICMR’s estimation of Lloyd’s pro-forma return on capital and WACC up to 2023, based on Lloyd's press release.
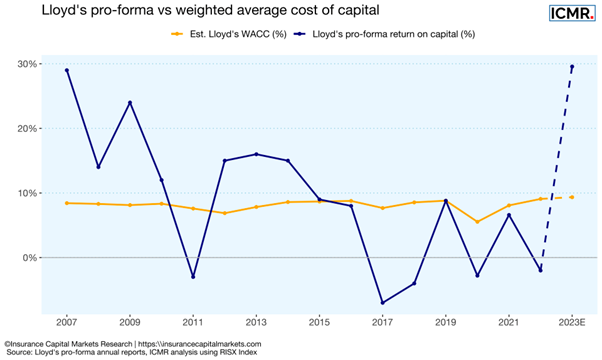
The chart shows that until 2014, Lloyd’s pro-forma returns generally exceeded WACC, with the exception being 2011 with its multiple severe catastrophe losses. The market was softening for several years thereafter before delivering a return in excess of WACC in 2023. It should be noted that this return to exceeding WACC has still taken three years of market rate hardening since the pandemic, which illustrates just how soft the market had become.
This snapshot of Lloyd’s declared results has been prepared by the LMA and ICMR https://insurancecapitalmarkets.com and will be followed by a more comprehensive report issued to our members following the publication of Lloyd’s and syndicates’ accounts.